Field distribution — time by field
Field distribution — time by field is a Jira dashboard gadget that shows how a JQL-scoped issue set's time is split across your Time Tracking custom fields — as normalized 100% stacked bars, one per project or assignee (or a single bar overall). Add it to a dashboard to answer "what's the mix?" in seconds.
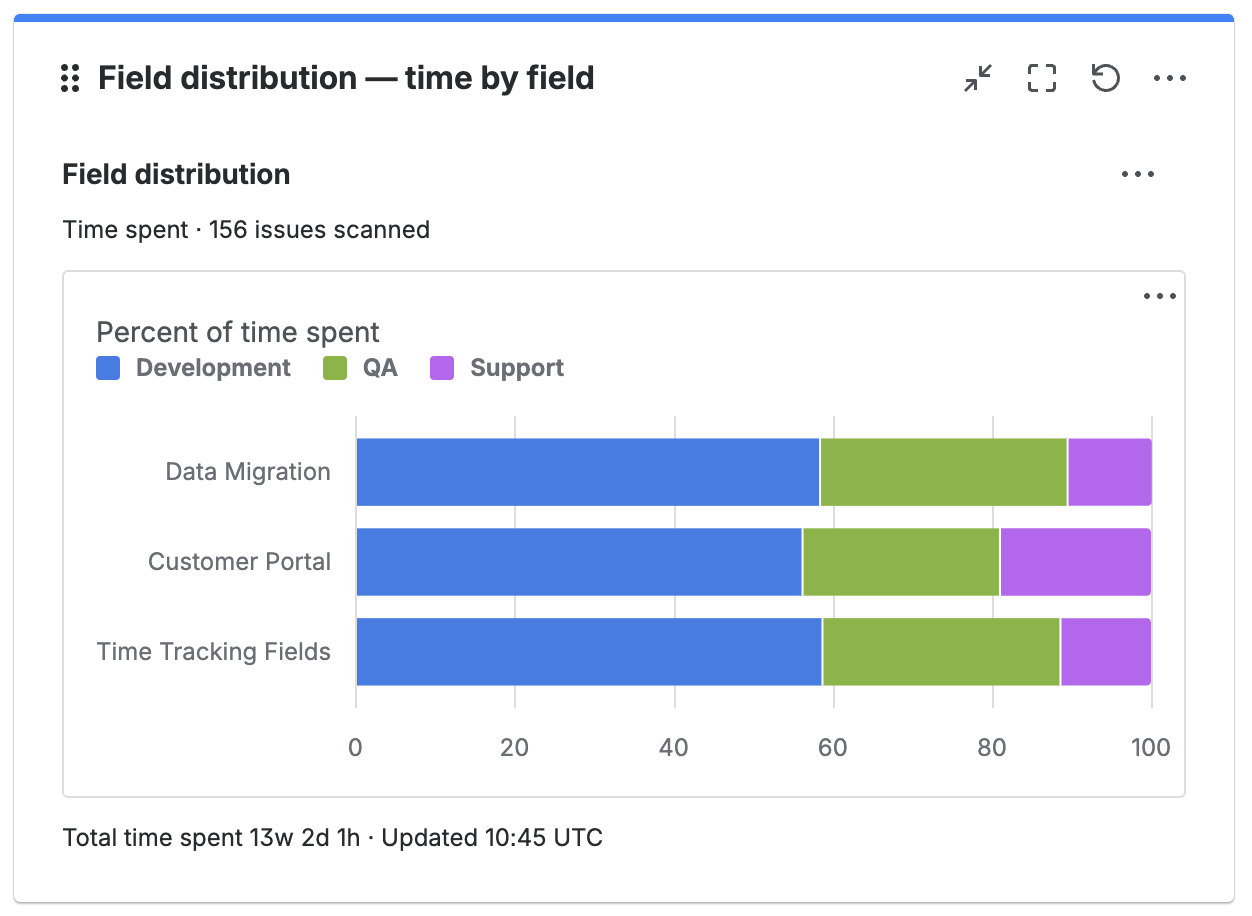
Field Distribution — three projects, each split into Development, QA, and Support time.
What it does
- One normalized 100% bar per group — a single bar in Overall breakdown mode, one bar per project or assignee when grouped.
- Three selectable metrics: Time spent (default), Original estimate, Remaining estimate.
- Three grouping modes: Overall breakdown, By project, By assignee.
- Built-in legend, per-segment tooltips, and a stable color for each field across every bar.
- Footer shows the overall total of the chosen metric, the scanned issue count, and the last refresh timestamp.
- Export the underlying data as a CSV with columns Group, Field, Metric, Value, Value (s), Share %.
The gadget reads values directly from issue fields — Original estimate, Time spent, and Remaining estimate for each Time Tracking field — and never scans individual worklogs. That keeps it fast on large issue sets.
Who it's for
Field Distribution is designed for Project Managers and Delivery Leads who need answers like:
- "What percentage of this sprint's time goes into QA vs Dev vs Contract work?"
- "Is one project consuming a disproportionate share of Support time?"
Unlike absolute reports, Field Distribution focuses on proportions — the mix of work across your Time Tracking fields, normalized per group so two projects with very different total volumes are still directly comparable.
Field Distribution vs Budget Burn
Both gadgets read the same Time Tracking field data and support the same grouping. The difference is absolute vs proportional presentation.
| Your question | Use |
|---|---|
| "How much budget is left? Are we over?" | Budget Burn |
| "What's the split between Dev / QA / Support time?" | Field Distribution |
| "Which project burns the most QA hours in absolute terms?" | Budget Burn (grouped by project) |
| "Which project has the highest QA-time share of its total?" | Field Distribution (grouped by project) |
Add the gadget to your dashboard
Open your Jira dashboard and add the gadget
Go to Dashboards in Jira's top navigation and open an existing dashboard, or create a new one. On the dashboard, click Add gadget to open the gadget picker. Search for field distribution or scroll to the Time Tracking Fields section, then click Add.
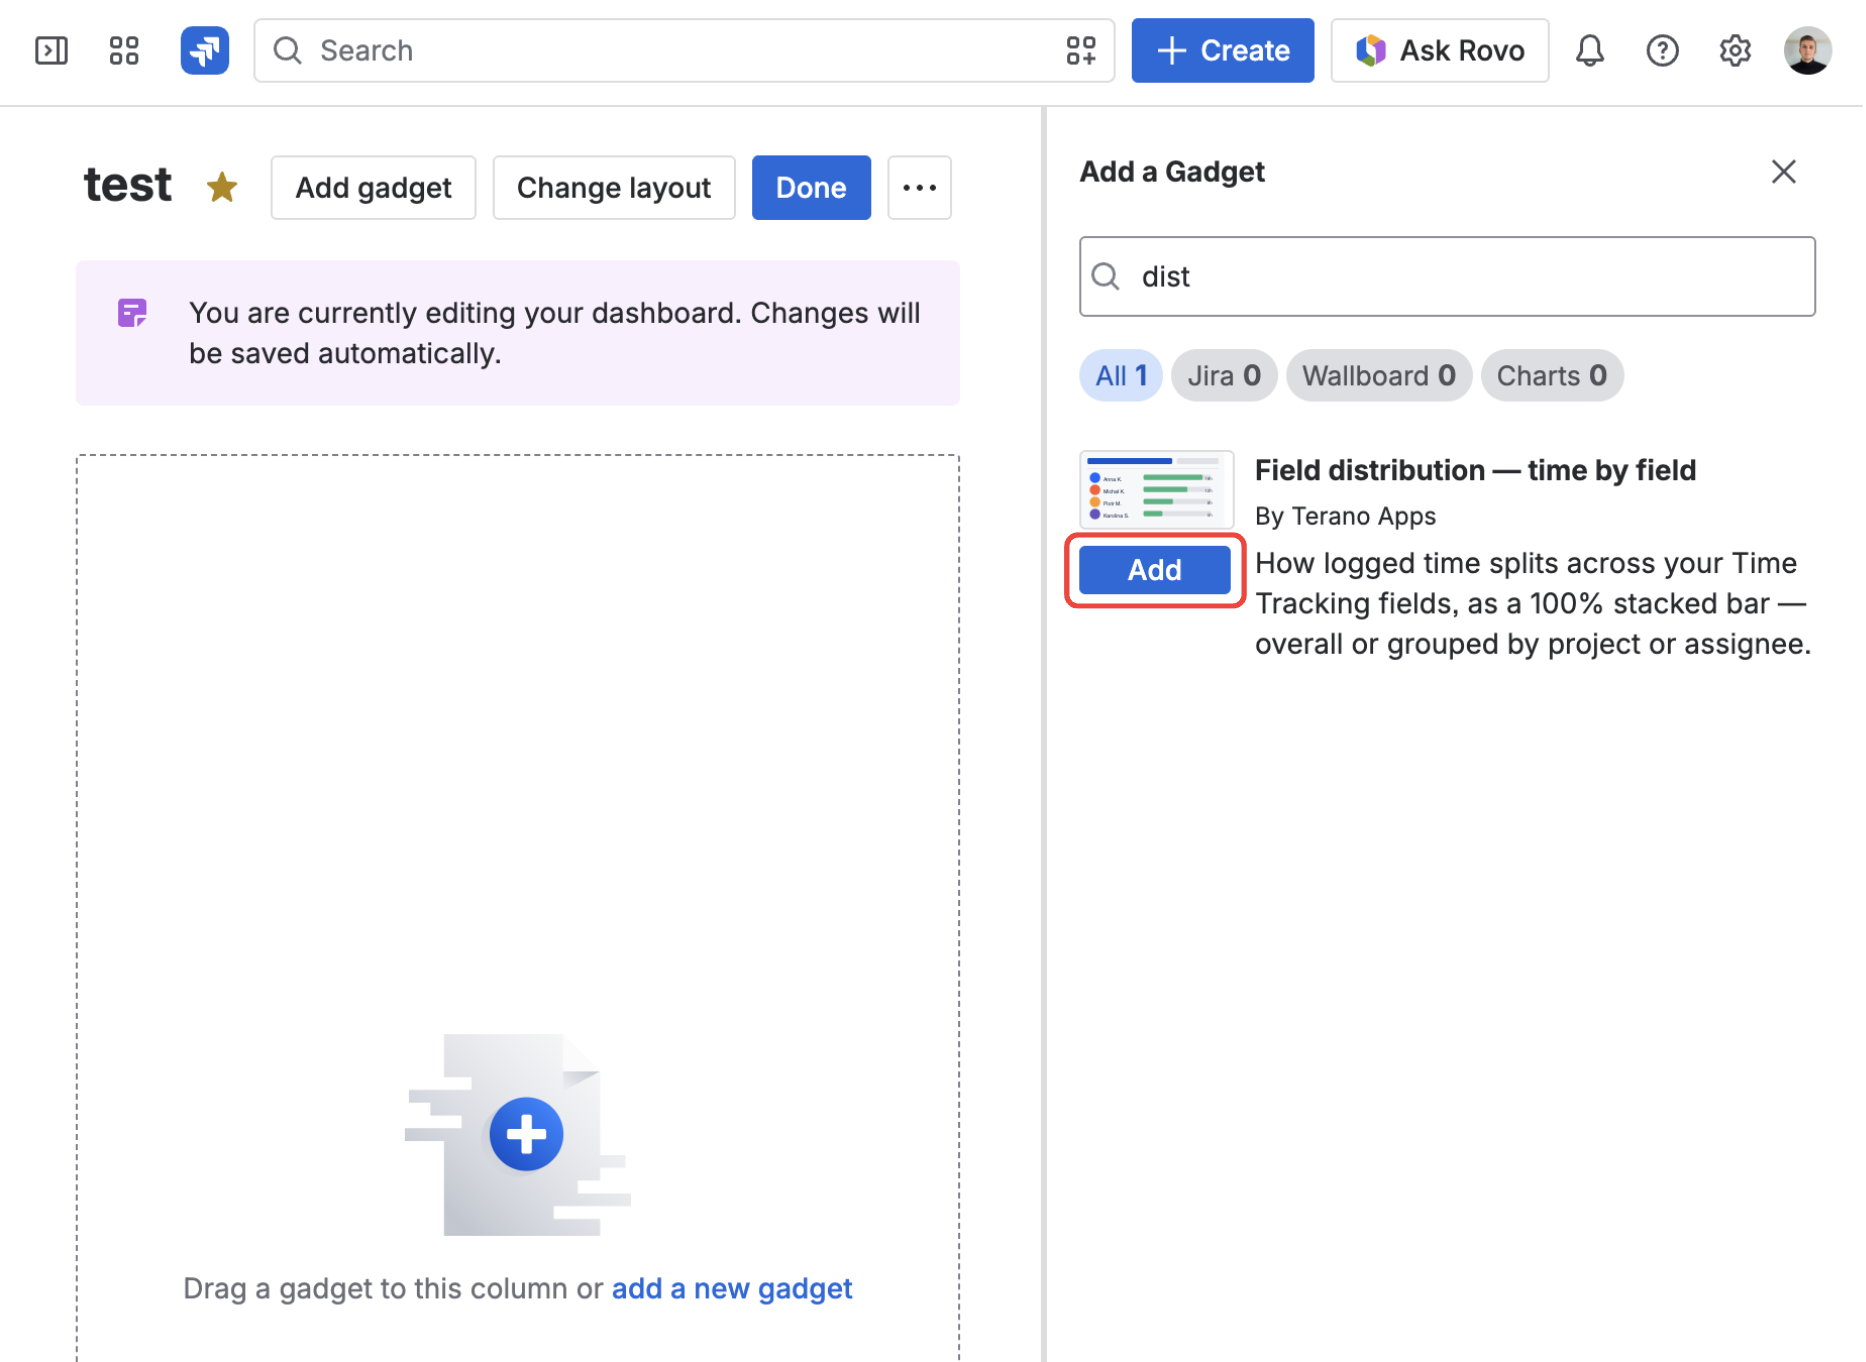
Find Field distribution — time by field in the gadget picker and click Add.
Configure the gadget
The gadget opens in edit mode. Pick one or more Time Tracking fields, choose a metric, set an optional JQL filter, pick a grouping, and optionally set a custom title. See Configuration options below for details.
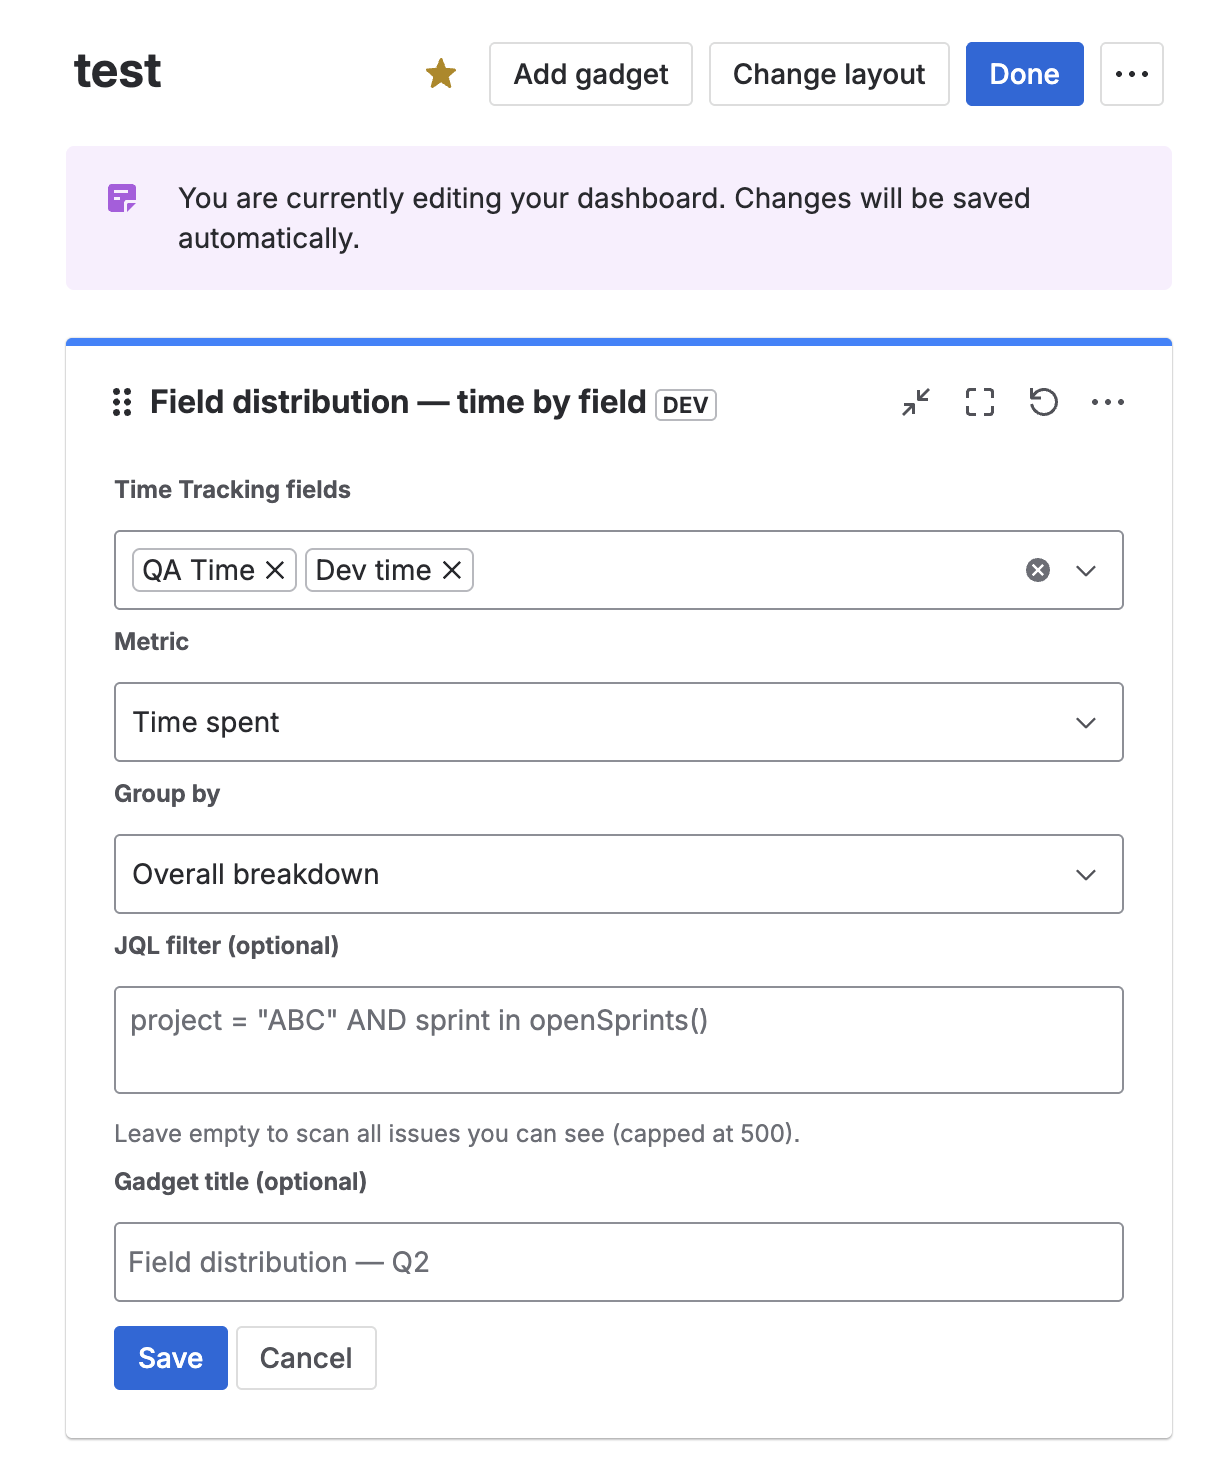
Configure the fields, metric, grouping, JQL scope, and optional title override.
Save
Click Save. The gadget switches to view mode and loads the first chart.
Add multiple instances of the gadget to the same dashboard — one scoped to project = "ABC" and another to project = "DEF" — to compare field mixes across projects side by side.
Configuration options
Edit the gadget (pencil icon in the gadget header) at any time to change settings.
| Option | Type | Required | Default | Description |
|---|---|---|---|---|
| Time Tracking fields | Multi-select | Yes | — | Which Time Tracking fields to include. Select one or more (up to 10). The list shows only fields created by this app. |
| Metric | Dropdown | No | Time spent | What the bar segments represent: Time spent, Original estimate, or Remaining estimate. |
| Group by | Dropdown | No | Overall breakdown | Overall breakdown (one bar across all matching issues), By project, or By assignee. |
| JQL filter | TextArea | No | (empty) | Scope the issue set. Empty means all issues the current viewer can access. |
| Gadget title override | Text | No | (empty) | Custom header text. Empty uses an auto title. |
Metric
Time spent (default) — each segment's length is that field's share of total time logged across the group.
Original estimate — segments represent each field's share of the planned budget. Useful for sanity-checking a sprint plan before work starts.
Remaining estimate — segments represent the share of work still left per field. Useful late in a sprint to see where the remaining effort lives.
The chart subtitle reflects the choice ("Percent of time spent", "Percent of original estimate", "Percent of remaining estimate"), and the CSV Metric column carries the same label.
Grouping modes
Overall breakdown (default) — every matching issue collapses into a single 100% bar split by field. Best for a portfolio-wide split: "across everything I'm scoping, what's the field mix?".
By project — one bar per Jira project. Each project's bar is normalized to 100%, so a small project and a large project are visually comparable.
By assignee — one bar per assignee. Each person's bar is normalized to 100% of their time — answering "what does this person spend their time on?" rather than "who logged the most?".
JQL filter
Scope the gadget to a sprint, project, epic, or any other JQL dimension. Examples:
project = "ABC" AND sprint in openSprints()
project in ("ABC", "DEF") AND "Epic Link" = ABC-100
statusCategory != Done
If the JQL matches more than 500 issues, the gadget stops scanning and shows a "Result may be incomplete" banner. Narrow the filter to see a complete result.
Reading the results
The gadget has three areas:
- Header — gadget title (your override, or the auto title) plus a refresh button (↻). Click to re-run the report.
- Chart — one horizontal bar per group, each normalized to 100%. Each colored segment is a Time Tracking field; the same field uses the same color across every bar. Hover a segment for its absolute value and share %. The legend lists every field once.
- Footer — overall total of the chosen metric · scanned issue count ·
Updated HH:MM.
Grouped views
When Group by is set to By project or By assignee, the chart stacks one bar per group vertically. Field colors stay consistent across every bar so the eye can compare mixes at a glance.
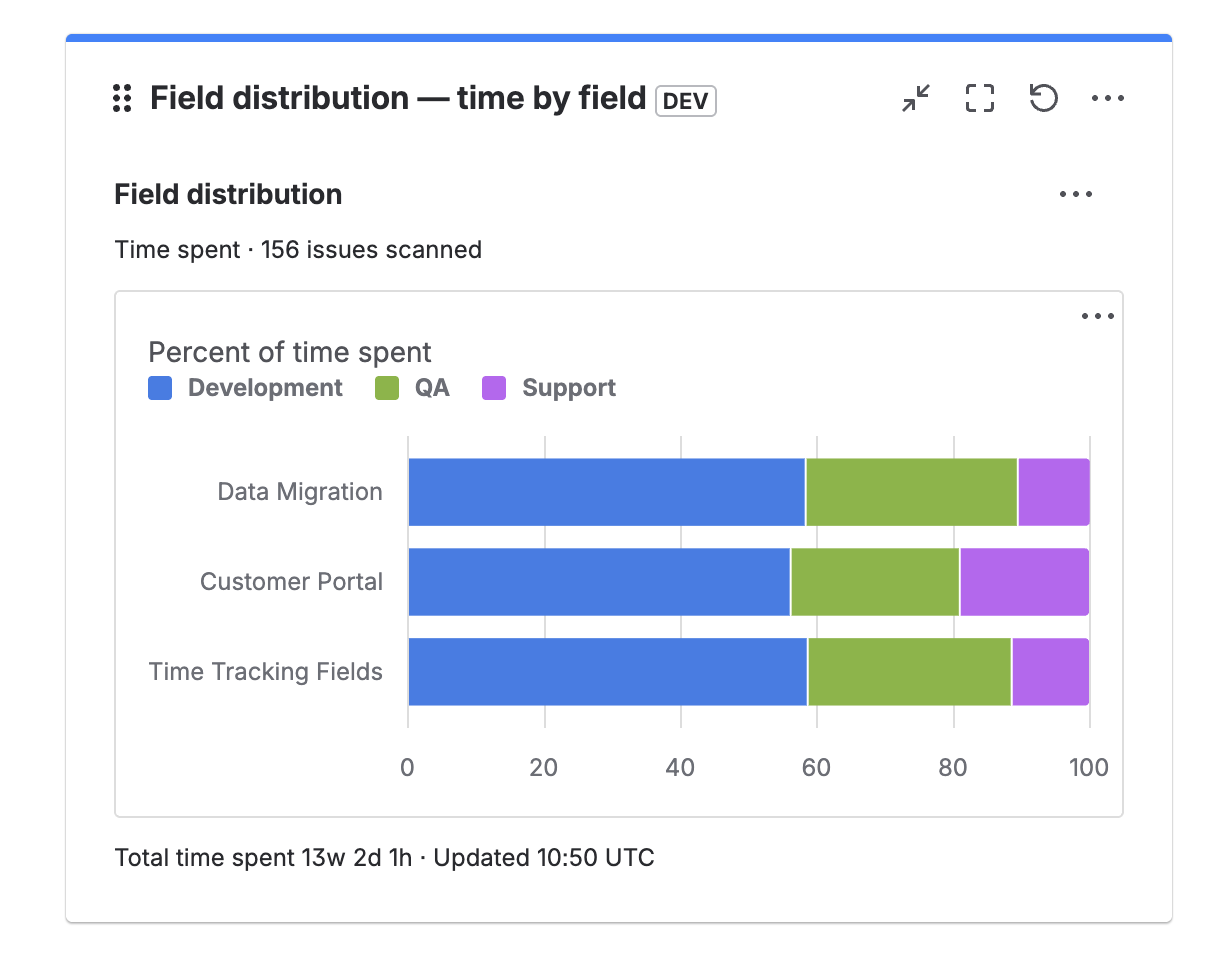
Grouped By project — each project's bar is normalized to 100% so different-size projects are directly comparable.
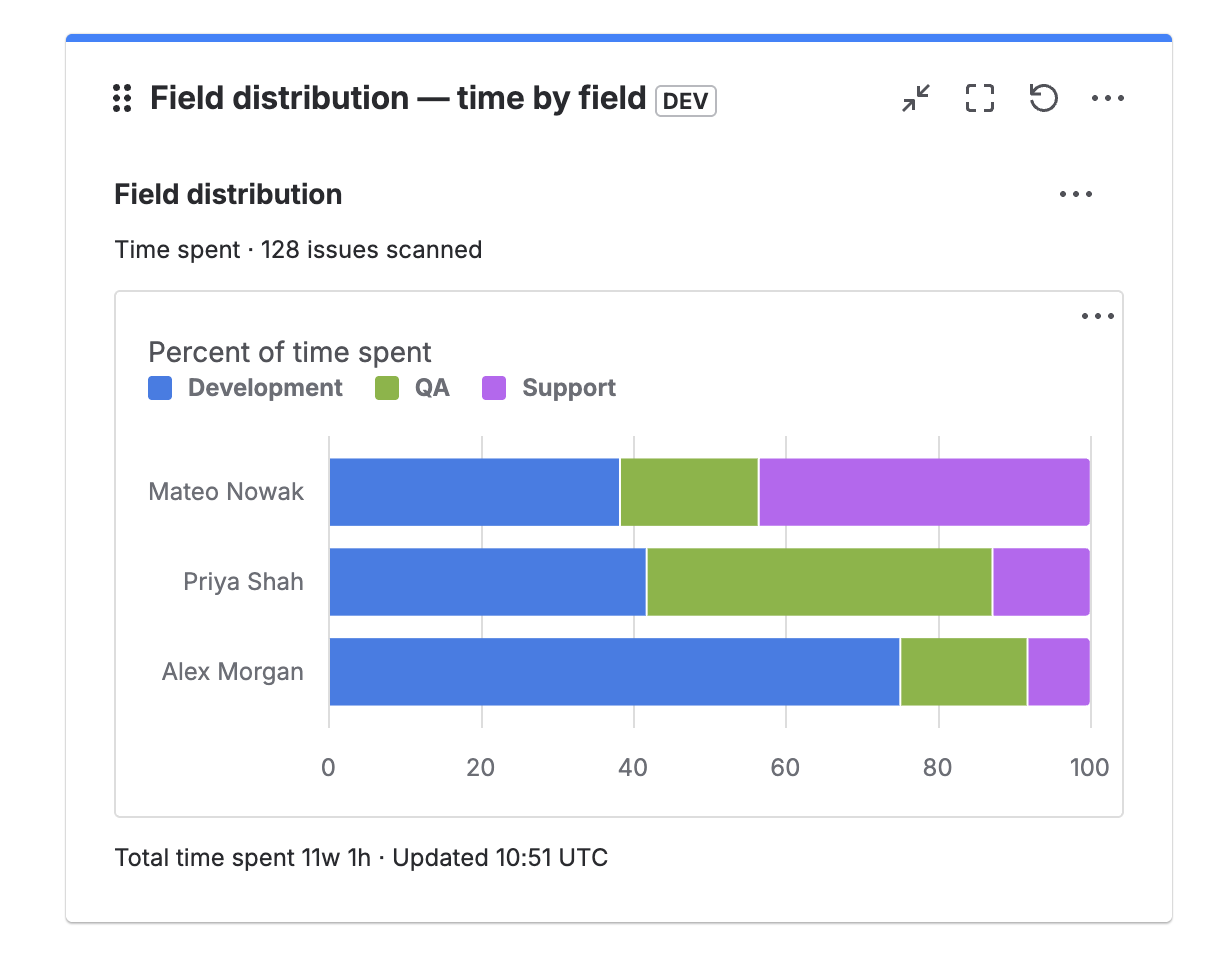
Grouped By assignee — each person's bar shows what their time is spent on, not how much they logged.
Limits and performance
- Issue scan cap — up to 500 issues per refresh. Past this, the "Result may be incomplete" banner appears. Narrow the JQL to stay under the cap.
- Fields cap — up to 10 Time Tracking fields per gadget instance.
- Speed — the gadget reads values directly from issue fields rather than scanning individual worklogs, so it stays fast on large issue sets.
- Permissions — each viewer only sees data from issues their own Jira permissions allow.
- Data source — only the custom Time Tracking fields created by this app are aggregated. Jira's built-in Time Tracking field is not included.
Export to CSV
The gadget exports the aggregated distribution data as a CSV with columns Group, Field, Metric, Value, Value (s), and Share %. See Export worklogs to CSV for details on the export flow.
FAQ
Why are all my bars the same length?
Because each bar is a normalized 100% distribution — every group's bar represents that group's total, split by field. Absolute amounts live in the segment tooltips, the footer, and the CSV. For absolute progress bars and over-budget warnings, use Budget Burn instead.
Can I see absolute time alongside the percentages?
Yes. Hover a segment for its absolute value. The footer shows the overall total of the chosen metric. The CSV has Value (formatted, e.g. 2d 4h) and Value (s) (raw seconds) columns.
How is this different from Budget Burn?
Budget Burn shows absolute original-estimate vs time-spent vs remaining with progress bars and over-budget warnings. Field Distribution shows each field's share of the chosen metric. Both support the same grouping (overall / project / assignee).
Does the gadget include Jira's built-in Time Tracking field?
No. It only aggregates the custom Time Tracking fields created by this app. For the built-in field, use Jira's native reports.
Can I filter by time range (This week, Last 30 days)?
Not in the current version — the gadget reads current field values directly. To scope by time, use a JQL clause like sprint in openSprints() or updated >= -30d.
Can I add multiple Field Distribution gadgets to the same dashboard?
Yes. Each instance is independently configured — for example, one scoped to project = "ABC" and another to project = "DEF".
Does it work in team-managed projects?
Yes — as long as the Time Tracking fields have been added to the relevant screens for the project.
Do I need additional Jira permissions to use this gadget?
No. The gadget uses the same permissions the app already requests and runs every call in the viewer's own context — you only see data from issues you can already access in Jira.