Cross-project time — by project
Cross-project time — by project is a Jira dashboard gadget for portfolio time tracking — it aggregates time logged across every Jira project you can see, grouped by project, with an optional per-user breakdown across projects. Add it to any dashboard to answer "where did our time go this week?" portfolio-wide — no JQL gymnastics, no spreadsheets, no leaving Jira.
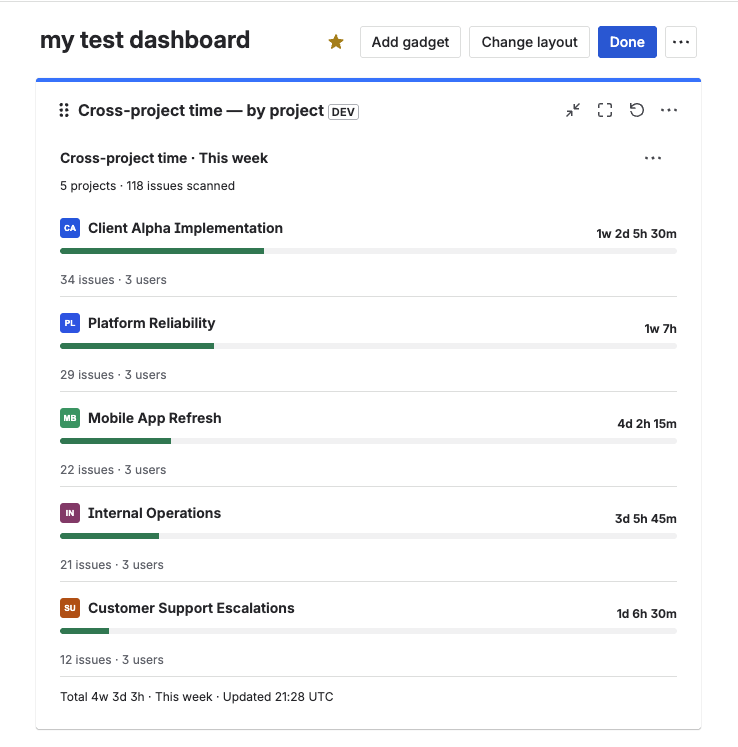
5 projects ranked by time logged — portfolio totals this week (4w 3d 3h across 118 issues).
What it does
- One row per Jira project with avatar, project name, total time logged (formatted like
2w 1d 3h), and a horizontal progress bar showing each project's share of the grand total across all visible projects. - Optional per-user breakdown — toggle on to expand each project into per-user sub-rows, each with the user's avatar, name, time logged, and a bar sized to that user's share of the project total.
- Projects are sorted descending by time logged — the busiest project sits at the top. Ties break on project name.
- Header shows your chosen title (or the auto title
Cross-project time · <Time range>) so the context of the view is always visible. - Footer summarizes the grand total, time range, and the time the data was last refreshed.
- Works with one or more Time Tracking fields at once (up to 10) — the gadget sums their worklogs into a single per-project number.
- Export the breakdown as CSV — for portfolio reporting, monthly leadership updates, or external invoicing.
The gadget aggregates only the worklogs logged through this app's Time Tracking fields. It does not aggregate native Jira worklogs or the built-in Jira Time Tracking field.
Who it's for
The gadget is designed for delivery leads, PMOs, agency owners, and engineering directors who need a time tracking report across multiple Jira projects — and a quick, visual answer to portfolio-level questions like:
- "Across all projects this month, where did the team's time actually go?"
- "Which two clients are eating up our capacity — and which people are doing the work?"
- "I have to send leadership a weekly portfolio summary — how do I get it in 10 seconds?"
- "Are we over-investing in internal projects vs paid client work?"
- "Who logged how much time across every project they touched this sprint?"
It's particularly useful for agencies and consultancies billing by project, engineering organizations running parallel programs, and JSM/JWM teams that need a per-user time view that crosses project boundaries — something Jira's native reports don't offer.
Unlike Team time — by user (which focuses on a single field within a single context) and Budget Burn — Estimate vs Actual (which compares estimates to actuals on a defined scope), Cross-project time is the bird's-eye view: how is the team's logged time distributed across the projects you can see?
Add the gadget to your dashboard
Open your Jira dashboard and add the gadget
Go to Dashboards in Jira's top navigation and open an existing dashboard, or create a new one. On the dashboard, click Add gadget to open the gadget picker. Search for cross-project or scroll to the Time Tracking Fields section, then click Add.
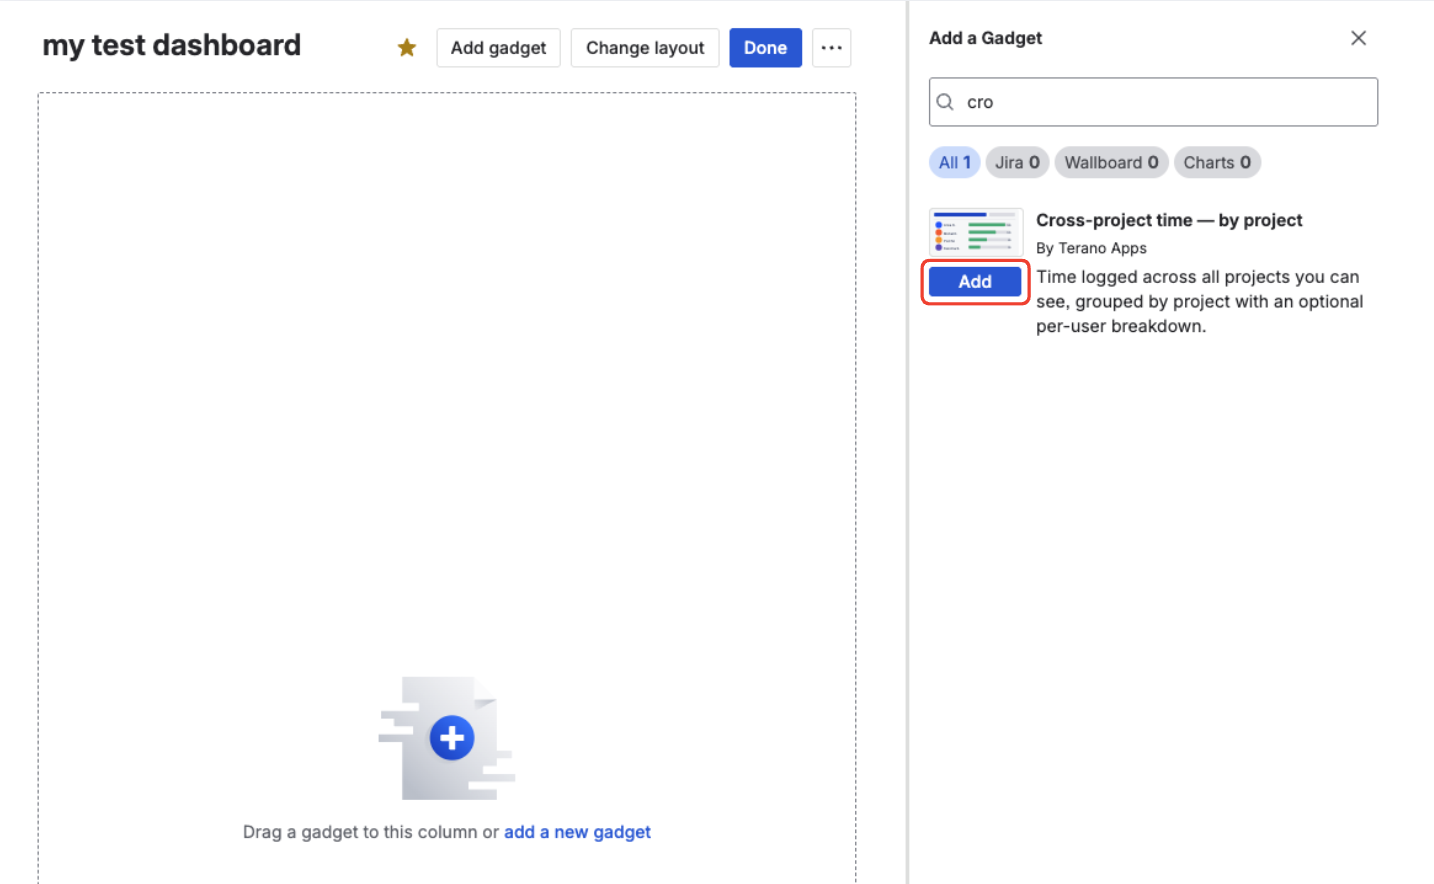
Find Cross-project time — by project in the gadget picker and click Add.
Configure the gadget
The gadget opens in edit mode. Pick one or more Time Tracking fields, a time range, and optionally a Billable filter, JQL filter, Break down by user toggle, and a custom title. See Configuration options below for details.
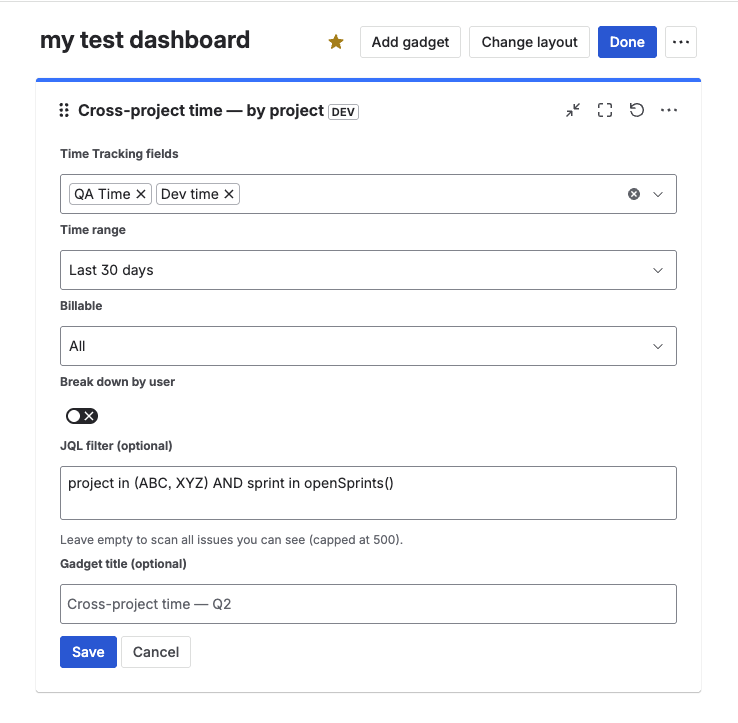
Configure fields, range, breakdown, filter, and display options.
Save
Click Save. The gadget switches to view mode and loads the first report.
Add multiple instances of the gadget on one dashboard — for example one filtered to project in (clientA, clientB) (paid client work) and another to project in (internal, R&D) (internal investment). It's the fastest way to see the split between billable and internal time across the portfolio.
Configuration options
Edit the gadget (pencil icon in the gadget header) at any time to change settings. All fields are described below.
| Option | Type | Required | Default | Description |
|---|---|---|---|---|
| Time Tracking fields | Multi-select | Yes | — | Which Time Tracking fields' worklogs to include. Select one or more (up to 10). The list shows only fields created by this app. |
| Time range | Dropdown | Yes | This week | Preset range: This week, Last week, This month, Last month, Last 7 days, Last 30 days. All ranges are in UTC. |
| Billable | Dropdown | No | All | Restrict aggregations and the gadget's CSV export to billable, non-billable, or all worklogs. |
| Break down by user | Toggle | No | On | When on, each project row expands into per-user sub-rows. When off, the gadget shows totals per project only (with a user-count summary). |
| JQL filter | TextArea | No | (empty) | Optional JQL clause (for example project in (ABC, DEF)). Empty means all issues the viewer can see. |
| Gadget title override | Text | No | (empty) | Custom header text. Empty means the gadget uses the auto title Cross-project time · <Time range>. |
Time range semantics
All presets are computed server-side in UTC:
- This week — Monday 00:00 UTC through now (ISO week).
- Last week — the previous ISO week: Monday 00:00 UTC through Sunday 23:59:59.999 UTC.
- This month — the 1st of the current month 00:00 UTC through now.
- Last month — the full previous calendar month in UTC.
- Last 7 days / Last 30 days — a rolling window ending "now".
If your team works in a timezone far from UTC, a Monday-morning "This week" view may still include a slice of the previous Friday in local time. Use Last 7 days for a strict rolling window that ignores ISO week boundaries.
Using the JQL filter
By default the gadget scans every issue the current viewer can see. Use the JQL filter when you want to narrow the portfolio to a specific slice — for example a client portfolio, a specific business unit, or a single sprint cycle. Examples:
project in ("ABC", "DEF", "GHI")
project in ("ABC", "DEF") AND sprint in openSprints()
labels = "client-billable"
statusCategory != Done
You don't need to add a worklogDate clause — the gadget automatically scopes worklogs to the selected time range.
If the JQL matches more than 500 issues, the gadget stops scanning and shows a "Result may be incomplete" banner. Narrow the filter, or pick a shorter time range, to see a complete result.
Filtering by Billable
Set Billable to restrict the gadget's totals and CSV export. Billable only aggregates worklogs flagged as billable, Non-billable only does the opposite, and All aggregates every worklog in scope.
Add two instances of the gadget on the same dashboard — one with Billable only and one with Non-billable only — to see invoiceable utilization vs internal time across the portfolio side by side.
For details on how the Billable flag is set on individual worklogs, see Billable / Non-billable worklogs.
Break down by user
When Break down by user is on (default), each project expands into per-user rows sorted by time logged. This is the right setting when you want to know both "which projects took our time?" and "who on the team worked on each one?" in a single view — particularly useful for cross-team or agency contexts.
Turn the toggle off when you only need the portfolio totals — for example a leadership-summary view where the names don't matter. The user count is still shown for each project (e.g. "42 issues · 7 users") so you don't lose that signal.
Gadget title
When you have several Cross-project gadgets on one dashboard, set a custom title for each (for example Client portfolio — this week, Internal work — this week) so the dashboard reads at a glance.
Reading the results
The rendered gadget has four areas:
- Header — gadget title (your override, or the auto title
Cross-project time · <Time range>) plus a refresh button (↻) and the export menu. Click the refresh button to re-run the report. - Sub-header — greyed-out summary of scope:
N projects · X issues scanned. - Project blocks — one block per project, sorted descending by time logged. Each block shows the project avatar, name, total time, a horizontal bar showing the project's share of the grand total, an
N issues · M userssummary, and (when Break down by user is on) per-user sub-rows underneath. - Footer — grand total, the active time range, and the time of the last refresh (
Updated HH:MM UTC).
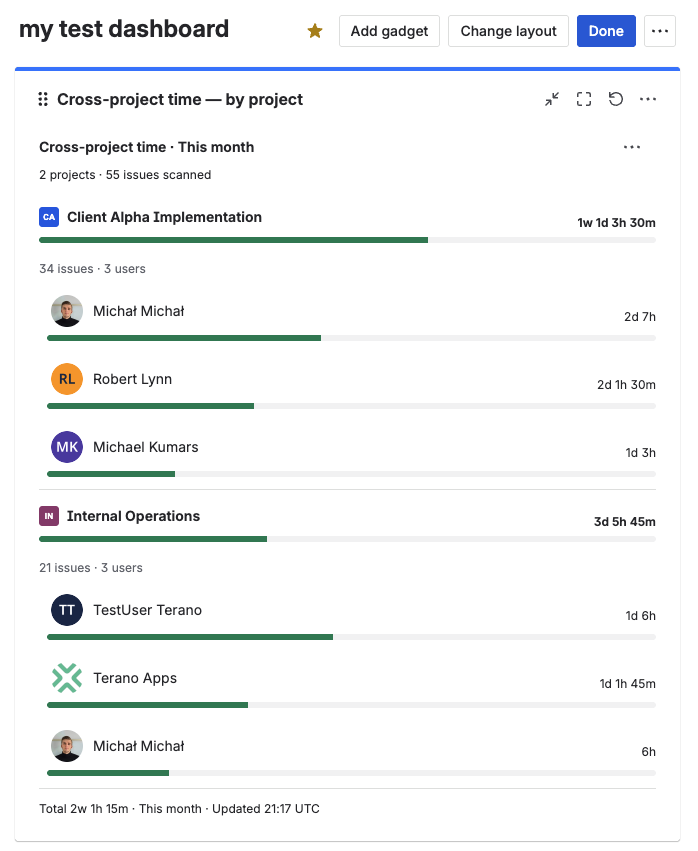
Per-user breakdown — each project expands into a sorted list of contributors.
If the gadget finds matching worklogs on issues that have no project set, they are bucketed into a single Unknown project row — so no logged time is lost from the totals.
Empty and error states
The gadget handles missing data and failures gracefully, so you always know what to do next.
| Situation | What you see | What to do |
|---|---|---|
| Gadget has just been added (no config yet) | Centered message plus a Configure button | Click Configure and pick at least one Time Tracking field |
| No worklogs in the selected range | Centered message: "No time logged in this range. Try a wider period or a different filter." | Pick a wider range, or change the JQL filter |
| Invalid JQL filter | Red banner with the error plus an Edit button | Edit the gadget and correct the JQL |
| JQL matches more than 500 issues | Yellow banner: "Result may be incomplete — narrow your JQL filter to under 500 issues." | Narrow the filter or choose a shorter range |
| Network error or timeout | Centered message: "Could not load data — please retry." plus a Retry button | Click Retry; if it persists, narrow the filter |
| License check fails | Standard license gate overlay | Check the licensing status on the Marketplace |
Limits and performance
- Issue scan cap — up to 500 issues per refresh. Past this, the "Result may be incomplete" banner appears. Narrow the JQL or pick a shorter range to stay under the cap.
- Fields cap — up to 10 Time Tracking fields per gadget instance.
- Users per project cap — up to 50 users shown per project block. If a project has more contributors in the selected range, only the top 50 by time logged are displayed; everyone is still counted in the project total.
- Speed — the gadget reads worklogs directly from the issue with no per-user lookups, so it stays fast even when many users have contributed across many projects.
- Permissions — every call runs in the viewer's context, so each viewer only sees projects, issues, and users that their own Jira permissions allow.
- Data residency — all aggregation happens inside your Atlassian site. The gadget reads worklogs from Jira and stores nothing on external servers, so portfolio data never leaves your Atlassian tenant.
- Data source — only the custom Time Tracking fields created by this app are aggregated. Jira's built-in Time Tracking field is not included.
Export to CSV
The gadget supports exporting the per-project (and, when Break down by user is on, per-user) breakdown as a CSV file — handy for portfolio reporting, monthly leadership decks, or feeding the data into external tools. The export includes the project key and name, the user display name and account ID (when broken down), the time logged in seconds and hours, and an issue count per project.
See Export worklogs to CSV for details on the export flow.
FAQ
How do I see time logged across all Jira projects in one view?
Add the Cross-project time gadget to any Jira dashboard, pick one or more Time Tracking fields, and choose a time range. Each project the viewer can see gets its own row with total time logged, an N issues · M users summary, and a progress bar sized to its share of the grand total. Leave the JQL filter empty to span every project; add project in (...) to scope to a specific portfolio.
Can I see per-user time logged across multiple projects? Yes — turn on Break down by user when configuring the gadget. Each project row expands into per-user sub-rows showing each contributor's avatar, name, time logged on that project, and a bar sized to their share of the project total. This is the right view when you need both "where did time go?" and "who worked on what?" in a single dashboard widget.
Does the gadget include Jira's built-in Time Tracking field? No. It only aggregates the custom Time Tracking fields created by this app. For the built-in field, use Jira's native reports.
How is this different from Team time — by user? Team time focuses on one Time Tracking field at a time and shows the breakdown across users in a single context. Cross-project time zooms out: it shows the breakdown across projects (and optionally users within each project), and lets you combine multiple Time Tracking fields into one total. Use Team time when you ask "who's logging time on this one thing?"; use Cross-project time when you ask "where across the portfolio is our time going?".
How is this different from Budget Burn? Budget Burn compares original estimates to time spent on a defined scope (JQL + fields), so it answers "are we on budget?". Cross-project time ignores estimates entirely and only sums time logged, so it answers "where did our hours actually go across projects?". They complement each other: Budget Burn for delivery health, Cross-project for capacity allocation.
Can I pick a custom date range (start/end)? Not in the current version. Pick one of the six presets. Custom date pickers are on the roadmap.
Can I export the breakdown to CSV? Yes. Open the gadget's ⋯ menu and click Export CSV. See Export worklogs to CSV.
Why is a project missing from the list? One of three reasons: (a) no worklogs were logged on its issues in the selected range, (b) the JQL filter excluded its issues, or (c) the current viewer does not have permission to browse that project. Widen the range or check your Jira project permissions.
Can I see only one project at a time?
Yes — set the JQL filter to project = "ABC". In that case, the gadget effectively becomes a "single-project time by user" view; the per-user breakdown shows everyone who logged time on that project.
Does the gadget show trends (this week vs last week)? Not yet. Add two instances — one for This week and one for Last week — and place them side by side to compare periods visually.
How do timezones affect the results? All ranges are computed in UTC. For teams in timezones that differ significantly from UTC, prefer Last 7 days / Last 30 days (rolling windows) over ISO-week presets.
Does it work in team-managed projects? Yes — as long as the Time Tracking fields have been added to the relevant screens for the project.
Do I need to add any Jira permissions for the gadget? No. The gadget uses the same permissions your app already requests and runs every call in the viewer's context — you only see data from issues and users that your own Jira permissions allow.
What happens when many users log time on one project? The gadget shows the top 50 contributors per project, sorted by time logged. Everyone is still counted in the project total and user count — the cap only affects how many individual rows are rendered.
Can multiple Cross-project gadgets coexist on the same dashboard? Yes. Each instance is independently configured — for example one filtered to client work, another to internal projects, and a third for the current quarter only.