Team time — by user
Team time — by user is a Jira dashboard gadget that shows how much time each person on your team has logged against a chosen Time Tracking custom field over a chosen period. Add it to any dashboard to see, in a few seconds, where your team's time went — no JQL, no extra tools, no leaving Jira.
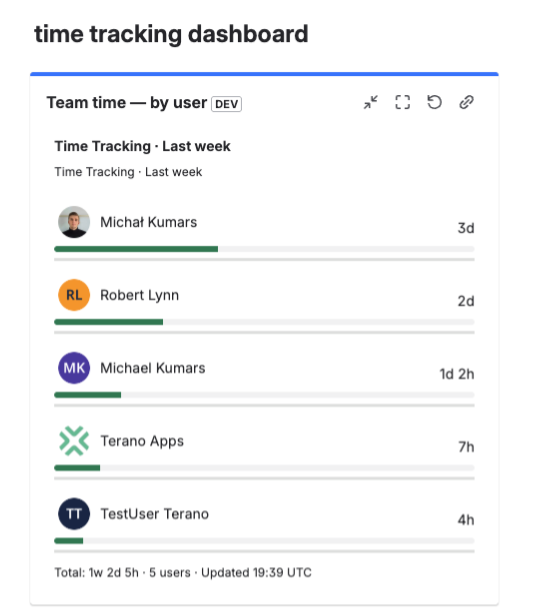
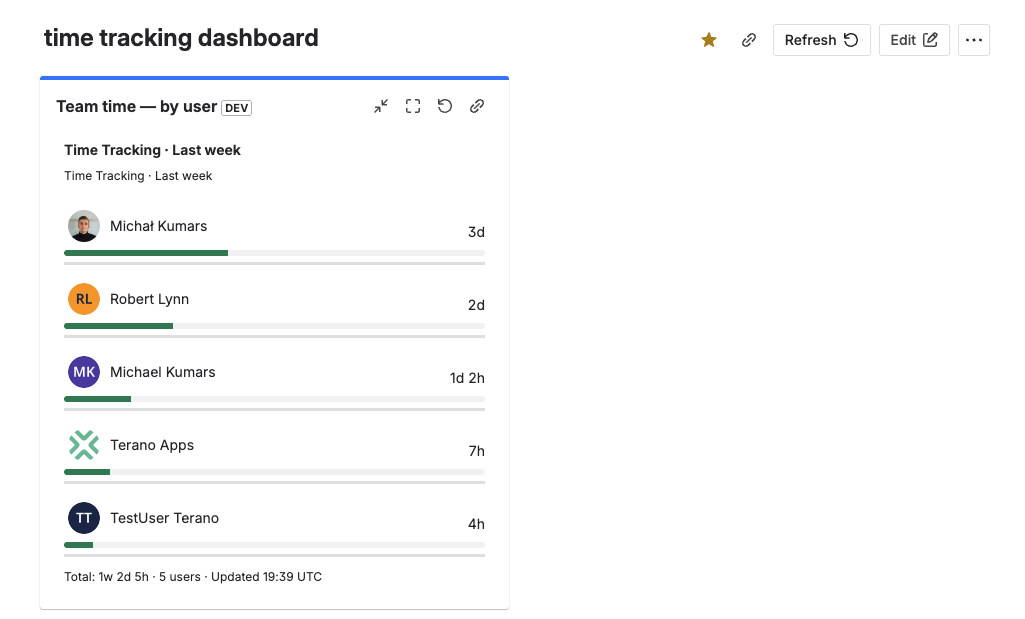
5 users, team total 1w 2d 5h — gadget on a real Jira dashboard.
What it does
- One row per user with avatar, display name, time logged (formatted like
2w 1d 3h), and a horizontal progress bar showing each user's share of the team total. - Rows are sorted descending by time logged — the top time logger sits at the top. Ties break on display name.
- Header shows
<Field name> · <Time range>(for example "Dev Time · Last 7 days"), so the context of the view is always visible. - Footer summarizes the team total, user count, and the time the data was last refreshed.
- Works with any Time Tracking field created by this app — Dev, QA, Contract Hours, or any custom field you have configured.
- Export raw worklogs as CSV — for invoicing, audits, or external reports.
The gadget aggregates only the worklogs logged through this app's Time Tracking fields. It does not aggregate native Jira worklogs or the built-in Jira Time Tracking field.
Who it's for
The gadget is designed for Jira Team Leads — engineering managers, QA leads, and delivery leads who need a quick, visual answer to questions like:
- "What did my team spend time on last week?"
- "Is anyone logging suspiciously little or suspiciously much?"
- "I need a time-split screenshot for the weekly status update — right now."
Because configuration is per-instance, a lead can drop several gadgets onto one dashboard — one per field — and read the full story at a glance.
Add the gadget to your dashboard
Open your Jira dashboard
Go to Dashboards in Jira's top navigation and open an existing dashboard, or create a new one.
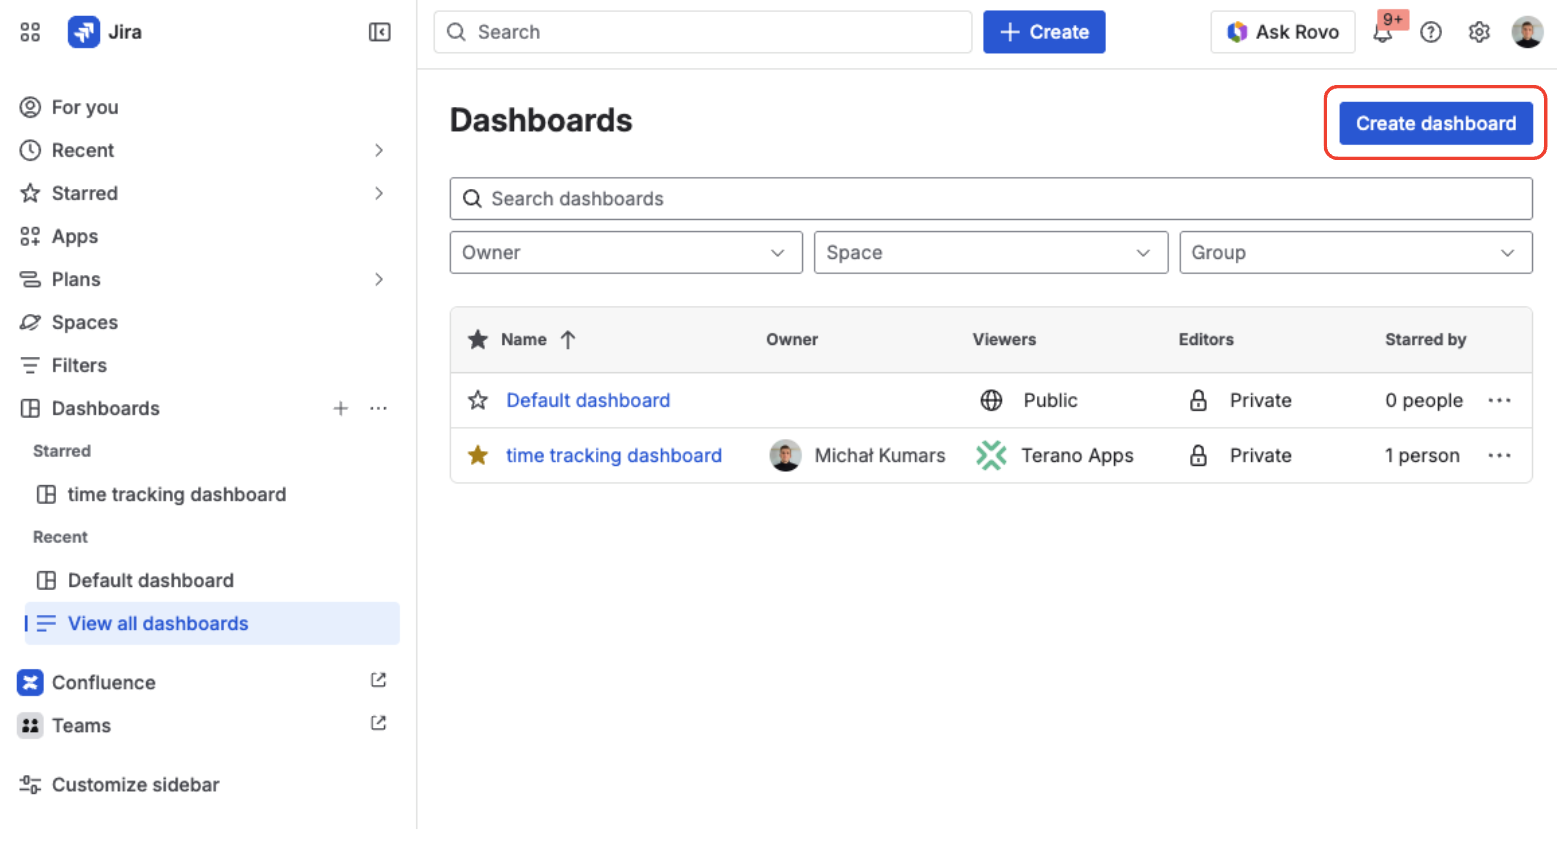
Open an existing dashboard or click Create dashboard.
Click "Add gadget" and find "Team time — by user"
On the dashboard, click Add gadget to open the gadget picker. Search for team time or scroll to the Time Tracking Fields section, then click Add.
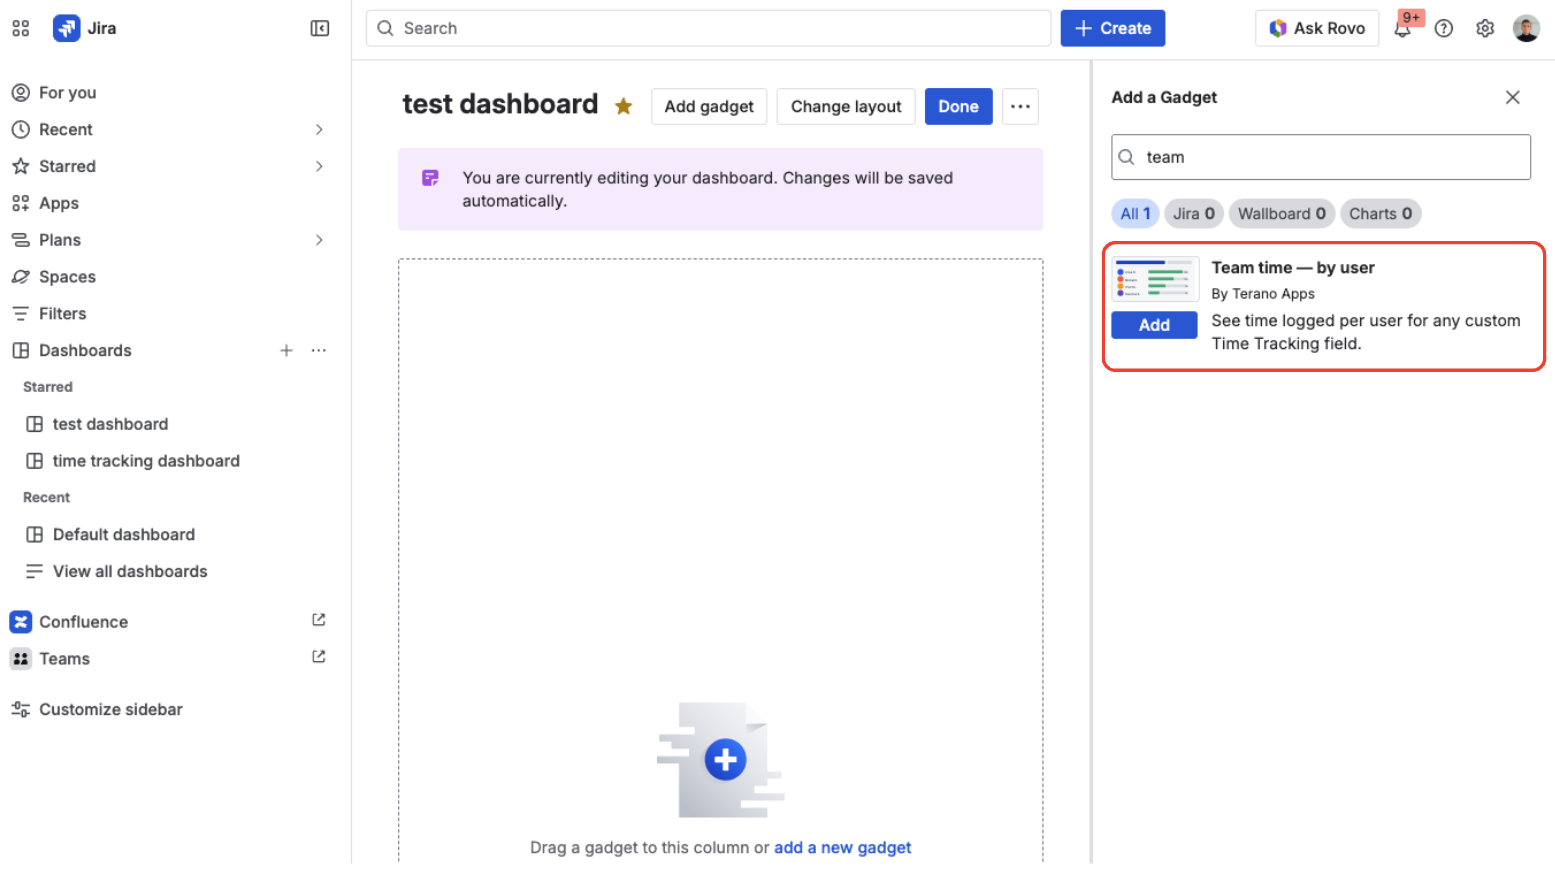
Click Add gadget, find Team time — by user, and click Add.
Configure the gadget
The gadget opens in edit mode. Pick a Time Tracking field, a time range, and optionally a JQL filter, max users, and a custom title. See Configuration options below for details.
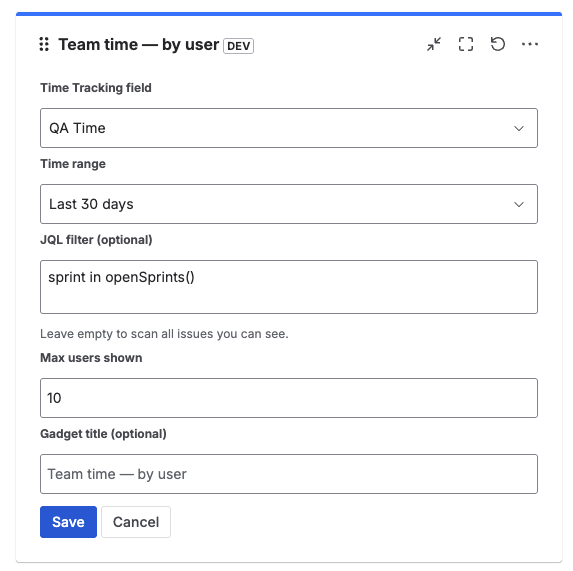
Gadget edit form — configure field, range, filter, and display options.
Save
Click Save. The gadget switches to view mode and loads the first report.
Team time — by user gadget on a Jira dashboard.
Add multiple instances of the gadget — one for each Time Tracking field (Dev, QA, Contract). It's the fastest way to see where your team's time is going across categories, side by side.
Configuration options
Edit the gadget (pencil icon in the gadget header) at any time to change settings. All fields are described below.
| Option | Type | Required | Default | Description |
|---|---|---|---|---|
| Time Tracking field | Dropdown | Yes | — | Which Time Tracking field to aggregate. The list shows only fields created by this app. |
| Time range | Dropdown | Yes | This week | Preset range: This week, Last week, This month, Last month, Last 7 days, Last 30 days. All ranges are in UTC. |
| JQL filter | TextArea | No | (empty) | Optional JQL clause (for example project = "ABC"). Empty means all issues the viewer can see. |
| Max users shown | Number | No | 10 | Number of rows in the table, from 1 to 25. Sorted descending, so you always see the top contributors. |
| Gadget title override | Text | No | (empty) | Custom header text. Empty means the gadget uses the auto title <Field name> · <Time range>. |
| Billable | Dropdown | No | All | Restrict aggregations and the gadget's CSV export to billable, non-billable, or all worklogs. |
Time range semantics
All presets are computed server-side in UTC:
- This week — Monday 00:00 UTC through now (ISO week).
- Last week — the previous ISO week: Monday 00:00 UTC through Sunday 23:59:59.999 UTC.
- This month — the 1st of the current month 00:00 UTC through now.
- Last month — the full previous calendar month in UTC.
- Last 7 days / Last 30 days — a rolling window ending "now".
If your team works in a timezone far from UTC, a Monday-morning "This week" view may still include a slice of the previous Friday in local time. Use Last 7 days for a strict rolling window that ignores ISO week boundaries.
Using the JQL filter
Narrow the scope to a specific project, epic, or sprint. Examples:
project = "ABC"
project in ("ABC", "DEF") AND "Epic Link" = ABC-100
statusCategory != Done
You don't need to add a worklogDate clause — the gadget automatically scopes worklogs to the selected time range.
If the JQL matches more than 500 issues, the gadget stops scanning and shows a "Result may be incomplete" banner. Narrow the filter, or pick a shorter time range, to see a complete result.
Filtering by Billable
Set Billable to restrict the gadget's totals and CSV export. Billable only aggregates worklogs flagged as billable, Non-billable only does the opposite, and All aggregates every worklog in scope.
Add two instances of the gadget on the same dashboard — one with Billable only and one with **Non-billable only ** — to see invoiceable utilization vs internal time side by side.
For details on how the Billable flag is set on individual worklogs, see Billable / Non-billable worklogs.
Gadget title
When you have several gadgets on the same dashboard, set a custom title for each (for example Dev time · this sprint, QA time · this sprint) so the dashboard reads at a glance.
Reading the results
The rendered gadget has four areas:
- Header — gadget title (your override, or the auto title
<Field name> · <Time range>) plus a refresh button (↻). Click the refresh button to re-run the report. - Sub-header — greyed-out
<Field name> · <Time range>label so the context is always visible, even if you customized the title. - Rows — one per user, sorted descending by time logged. Each row shows the avatar, name, formatted time, and a horizontal progress bar sized to the user's share of the team total.
- Footer — team total, user count, and the time of the last refresh (
Updated HH:MM).
Click a row to open native Jira issue search in a new tab, pre-filtered to that user's worklogs in the selected range. Use it to drill into specific issues without leaving Jira.
Empty and error states
The gadget handles missing data and failures gracefully, so you always know what to do next.
| Situation | What you see | What to do |
|---|---|---|
| Gadget has just been added (no config yet) | Centered message plus a Configure button | Click Configure and pick a Time Tracking field |
| No worklogs in the selected range | Centered message: "No time logged in this range. Try a wider period or different filter." | Pick a wider range, or change the JQL filter |
| Invalid JQL filter | Red banner with the error plus an Edit button | Edit the gadget and correct the JQL |
| JQL matches more than 500 issues | Yellow banner: "Result may be incomplete — narrow your JQL filter to under 500 issues." | Narrow the filter or choose a shorter range |
| Network error or Forge timeout | Centered message: "Could not load data — please retry." plus a Retry button | Click Retry; if it persists, narrow the filter |
| License check fails | Standard license gate overlay | Check the licensing status on the Marketplace |
Limits and performance
The gadget runs inside Atlassian Forge and is bounded by the platform's function budget. Hard and soft limits:
- Issue scan cap — up to 500 issues per refresh. Past this, the "Result may be incomplete" banner is shown. Narrow the JQL or pick a shorter range to stay under the cap.
- User cap — up to 25 rows per table (default: 10). You always see the top contributors first.
- Platform budget — each refresh must finish inside Jira's 10-second function budget. The gadget targets p95 < 4 s for 100 issues in range.
- Issue pages — issue lookups are batched in pages of 100; per-issue worklog reads run with a concurrency of 10 to stay within Forge I/O limits.
- Data source — only worklogs added through this app's Time Tracking fields are aggregated. Native Jira worklogs and Jira's built-in Time Tracking field are not included.
- Permissions — every call runs
asUser(), so each viewer only sees issues and users that their own Jira permissions allow.
Export to CSV
The gadget supports exporting all worklogs that match its filters as a CSV file — handy for invoicing, audits, or feeding the data into external reports. See Export worklogs to CSV for details.
FAQ
Does the gadget include Jira's built-in Time Tracking field? No. It only aggregates the custom Time Tracking fields created by this app. For the built-in field, use Jira's native reports.
Can I pick a custom date range (start/end)? Not in the current version. Pick one of the six presets. Custom date pickers are on the roadmap.
Can I export the table to CSV? Yes. Click Export CSV in the gadget header to export all worklogs that match the gadget's filters. See Export worklogs to CSV.
Why are some users missing from the table? One of three reasons: (a) they have no worklogs in the selected range, (b) the JQL filter excludes their issues, or (c) they fall outside the Max users shown limit. Increase the limit or widen the range.
Does it work in team-managed projects? Yes — as long as the Time Tracking fields have been added to the relevant screens for the project.
Does the gadget show trends (this week vs last week)? Not yet. Add two instances — one for "This week" and one for "Last week" — to compare periods visually.
How do timezones affect the results? All ranges are computed in UTC. For teams in timezones that differ significantly from UTC, prefer Last 7 days / Last 30 days (rolling windows) over ISO-week presets.
Do I need to add any Jira permissions for the gadget?
No. The gadget uses the same permissions your app already requests (read:jira-work, read:jira-user, storage:app) and runs every call in the viewer's context.