Dashboard Gadget
The Dashboard Gadget provides a management-level view of issue deletion activity across your Jira instance. Add it to any Jira Dashboard to monitor deletion trends, track recovery rates, and identify which projects need attention — without opening the operational panel.
Adding the gadget
- Open any Jira Dashboard.
- Click Edit (top right).
- Click Add gadget.
- Search for Restorify.
- Click Add gadget to place it on the dashboard.
You can add multiple instances of the gadget to the same dashboard — for example, one scoped to a specific project and one showing the global view.
Gadget configuration
Each gadget instance has its own settings. Click the gear icon on the gadget to open the configuration panel.
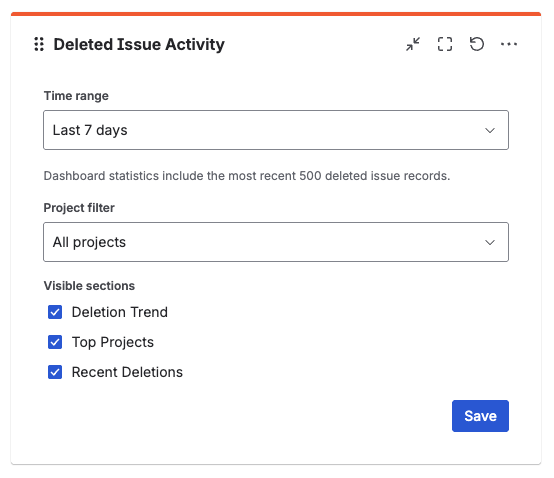
- Time range — Last 7 / 30 / 90 days
- Project — All tracked projects or a specific project
- Show deletion trend — toggle the trend chart on or off
- Show top projects — toggle the top projects chart on or off
- Show recent deletions — toggle the recent deletions table on or off
Changes take effect immediately after saving the configuration.
Gadget sections
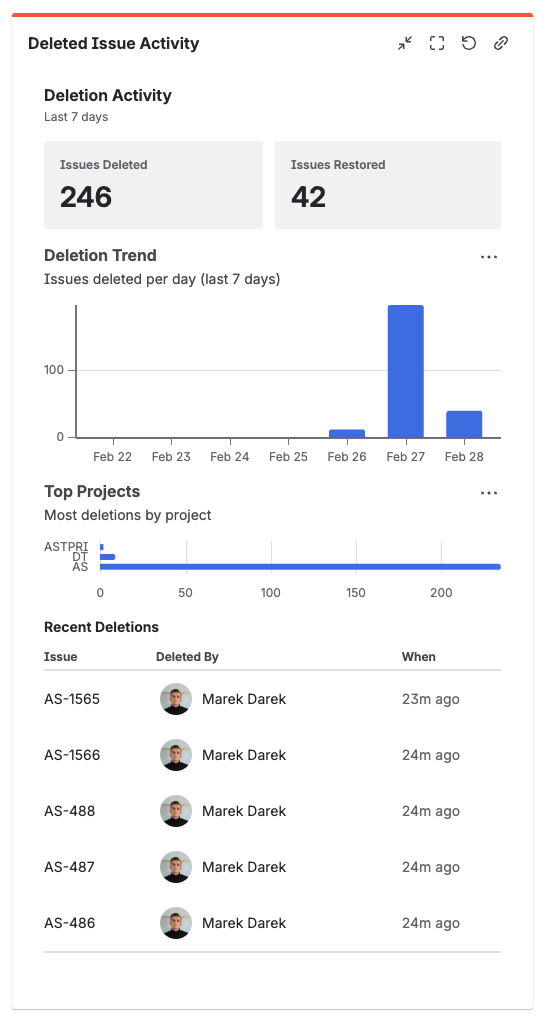
Summary Stats
Always visible at the top of the gadget. Shows four key numbers for the configured time range and project scope:
- Total deleted — issues deleted in tracked projects during the time range
- Total restored — restore attempts initiated during the time range
- Successful restores — restores that completed with success or partial status
- Failed restores — restores that completed with failed status
This view answers the most important management question in seconds: is the organization losing more than it recovers?
Deletion Trend Chart
A line chart showing the number of deletions per day over the selected time range.
What to look for:
- Baseline — what is the normal daily deletion rate for your instance?
- Spikes — a sudden increase may indicate an automation error, bulk cleanup, or a departing user
- Trends — a gradual increase may indicate that users or automations are deleting more frequently over time
Top Projects Chart
A bar chart showing the 5 projects with the highest deletion count in the selected time range.
What to look for:
- Projects at the top consistently may need process review or stronger governance
- A project appearing for the first time at the top after a change is a signal to investigate
- Use this to prioritize which projects to upgrade from Basic to Extended tracking
Recent Deletions
A list of the 5 most recently deleted issues across the selected scope — with issue key, summary, project, who deleted it, and when. Click any issue key to open its snapshot detail directly.
This section acts as a bridge between the dashboard view and the operational panel — if you see something unexpected, you are one click away from the full record.
What's next?
- Browse Deleted Issues — search and restore from the full list
- Audit Trail — detailed log of all app events
- Restore an Issue — recover a deleted issue